How to Tell How Much Virtual Machine Storage Is Really Being Used
Here’s how to interpret virtual machine storage data generated by PowerShell Resource Metering.
October 26, 2020

For more technical explainers on PowerShell, read our updated PowerShell 101: A Technical Explainer for IT Pros report.
Although Microsoft Hyper-V Manager provides some basic metrics about Hyper-V VM resource usage, it is possible to get far more detailed information through PowerShell by using a feature called Resource Metering. However, the key to using resource metering to effectively gauge virtual machine storage is understanding how to interpret the data.
Resource metering is not enabled by default. You can enable it to assess specific virtual machine storage by establishing a PowerShell session with the Hyper-V host and then entering the Enable-VMResourceMetering command, followed by the name of the virtual machine. You can see what this looks like in Figure 1.

Resource Metering 1
Figure 1
This is how you enable resource metering for a Hyper-V virtual machine.
Once you have enabled resource metering, you can examine virtual machine storage use by using the Measure-VM cmdlet, followed by the virtual machine’s name. You can see what this looks like in Figure 2.

Resource Metering 2
Figure 2
This is what it looks like when you measure a VM’s resources.
As you can see in the figure above, only one of the reported metrics is storage related (TotalDisk (M)). According to Microsoft, this metric reflects the virtual machine’s average disk usage in megabytes. While this explanation seems simple enough, there is one major caveat to be aware of. Resource metering reports usage data only for virtual hard disks that are attached directly to the virtual machine. If storage is attached by way of a virtual Fibre Channel connection or a network adapter that has been configured to use SR-IOV (Single Root I/O Virtualization), those devices will not be included in the metrics. This is true not just for the TotalDisk (M) metric, but also for other storage-related metrics reported by the Measure-VM cmdlet.
If you want to see all of the available metrics, simply use this command:
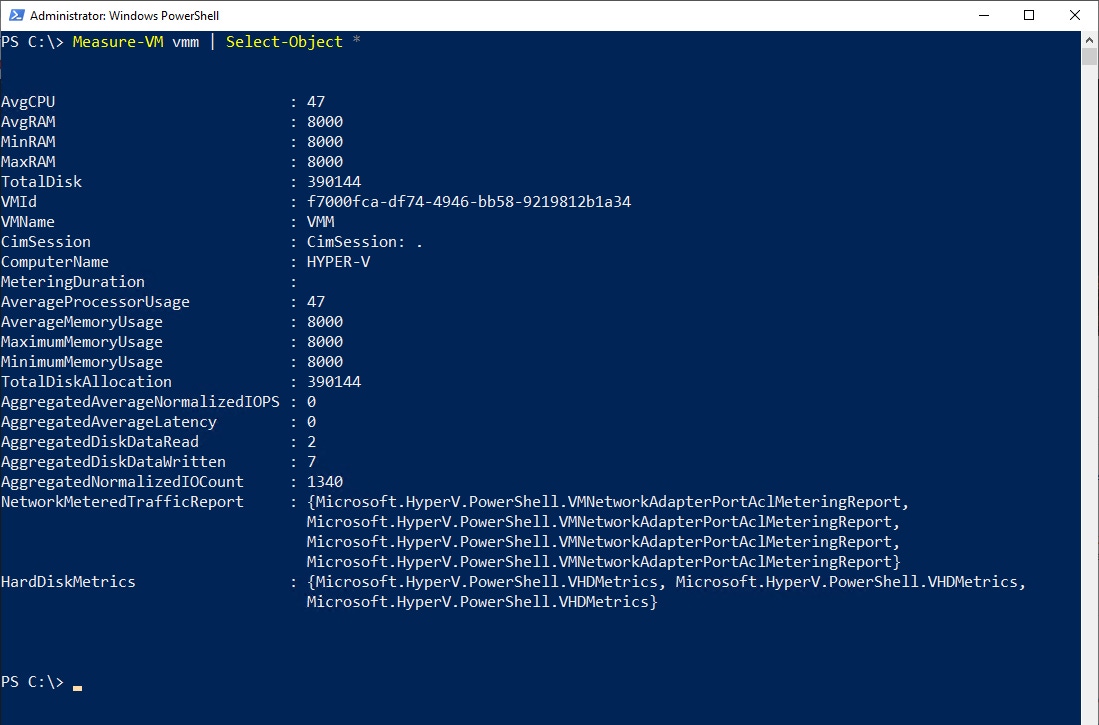
Measure-VM | Select-Object *You can see what the output looks like in Figure 3.

Resource Metering 3
Figure 3
These are all of the metrics that Resource Metering records for a Hyper-V virtual machine.
As you look at the figure above, you will see that there are a number of storage-related metrics being reported. Some of the more useful metrics include:
AggregatedAverageNormalizedIOPS
AggregatedAverageLatency
AffregatedDiskDataRead
AggregatedDiskDataWritten
AggregatedNormalizedIOCount
These metrics reflect aggregate totals across the virtual machine’s virtual hard disks.
The Measure-VM cmdlet also displays a TotalDiskAllocation metric. This is different from the TotalDisk metric that was mentioned previously. The TotalDiskAllocation reflects the total disk capacity (in megabytes) that was allocated to the VM. This particular metric, however, can be somewhat misleading.
The first thing that you need to know about this metric is that it is actually based on the sum of two totals, including the total capacity of the virtual hard disks that are attached to the VM and the capacity consumed by checkpoints of the virtual machines. Checkpoints are what Microsoft calls Hyper-V snapshots.
The other thing that you need to know about this metric is that it is based on a period of time. As such, the TotalDiskAllocation reflects the storage that was allocated to the VM during the metering duration (which is displayed among the other Measure-VM statistics).
The Measure-VM cmdlet can actually provide you with a bit more storage-related metering data than what is shown in the previous screen capture. If you look back at the previous figure, you will notice that the very last item on the list is HardDiskMetrics. However, PowerShell does not return a value for HardDiskMetrics. The reason for this is that HardDiskMetrics is actually a collection of additional metrics that you can access by using the ExpandProperty option. Here is the command that you will need to use:
Measure-VM | Select-Object -ExpandProperty HardDiskMetricsAs noted, most of the storage-related statistics returned by the Measure-VM cmdlet are based on aggregate values. However, the command listed above lists metering data for each individual virtual hard disk that is attached to the VM. The VM being measured in Figure 4, for example, has three virtual hard disks, and you can see data for each.

Resource Metering 4
Figure 4
PowerShell can report on each individual virtual hard disk.
As you can see, resource metering can provide a wealth of information about virtual machine storage use. Because this information is available on a per-virtual-machine basis, it is possible to use PowerShell to create reports of how your VMs are collectively using the storage resources that have been made available to them.
About the Author
You May Also Like


.jpg?width=700&auto=webp&quality=80&disable=upscale)
