The Microsoft Security Intelligence Report (SIR) is a regular threat assessment report from Microsoft that collates data collected through the companies opted in cloud, on-premises, and end point systems.
As you might imagine, a company with the breadth of services and systems like Microsoft has certainly gets a unique look at the overall landscape when it comes to security.
They have been publishing the SIR semi-annually in the past however, starting with this edition, Volume 22, they will now publish a quarterly report in order to make this analysis available to the public on a more regular basis. This will allow it to be more actionable compared to releasing the data every six months.
In Volume 22 they are discussing data that was collected in the first three months of this year, January to March 2017, and compare that to the same period in the previous year. In the case of Volume 22 that would be January to March 2016.
The entire 74 page report can be downloaded from the Microsoft Secure website at:
https://www.microsoft.com/en-us/security/intelligence-report
Along with the change in periodicity, Microsoft is also modifying the report format slightly to provide two main focus areas - cloud and endpoint - which they expect will provide a much broader visibility for all users including those in a hybrid setup.
I have pulled out a few key charts for this gallery to give you a quick snapshot to show you some trends when it comes to malicious software, malicious access to Microsoft Accounts, and where attacks tend to originate.
One I want to pull out to this main page is a chart that shows the various reasons certain versions of Windows are reporting that they are in a non-protected state - in other words - not running security software for anti-virus/malware protection.
Let's begin with the chart itself:
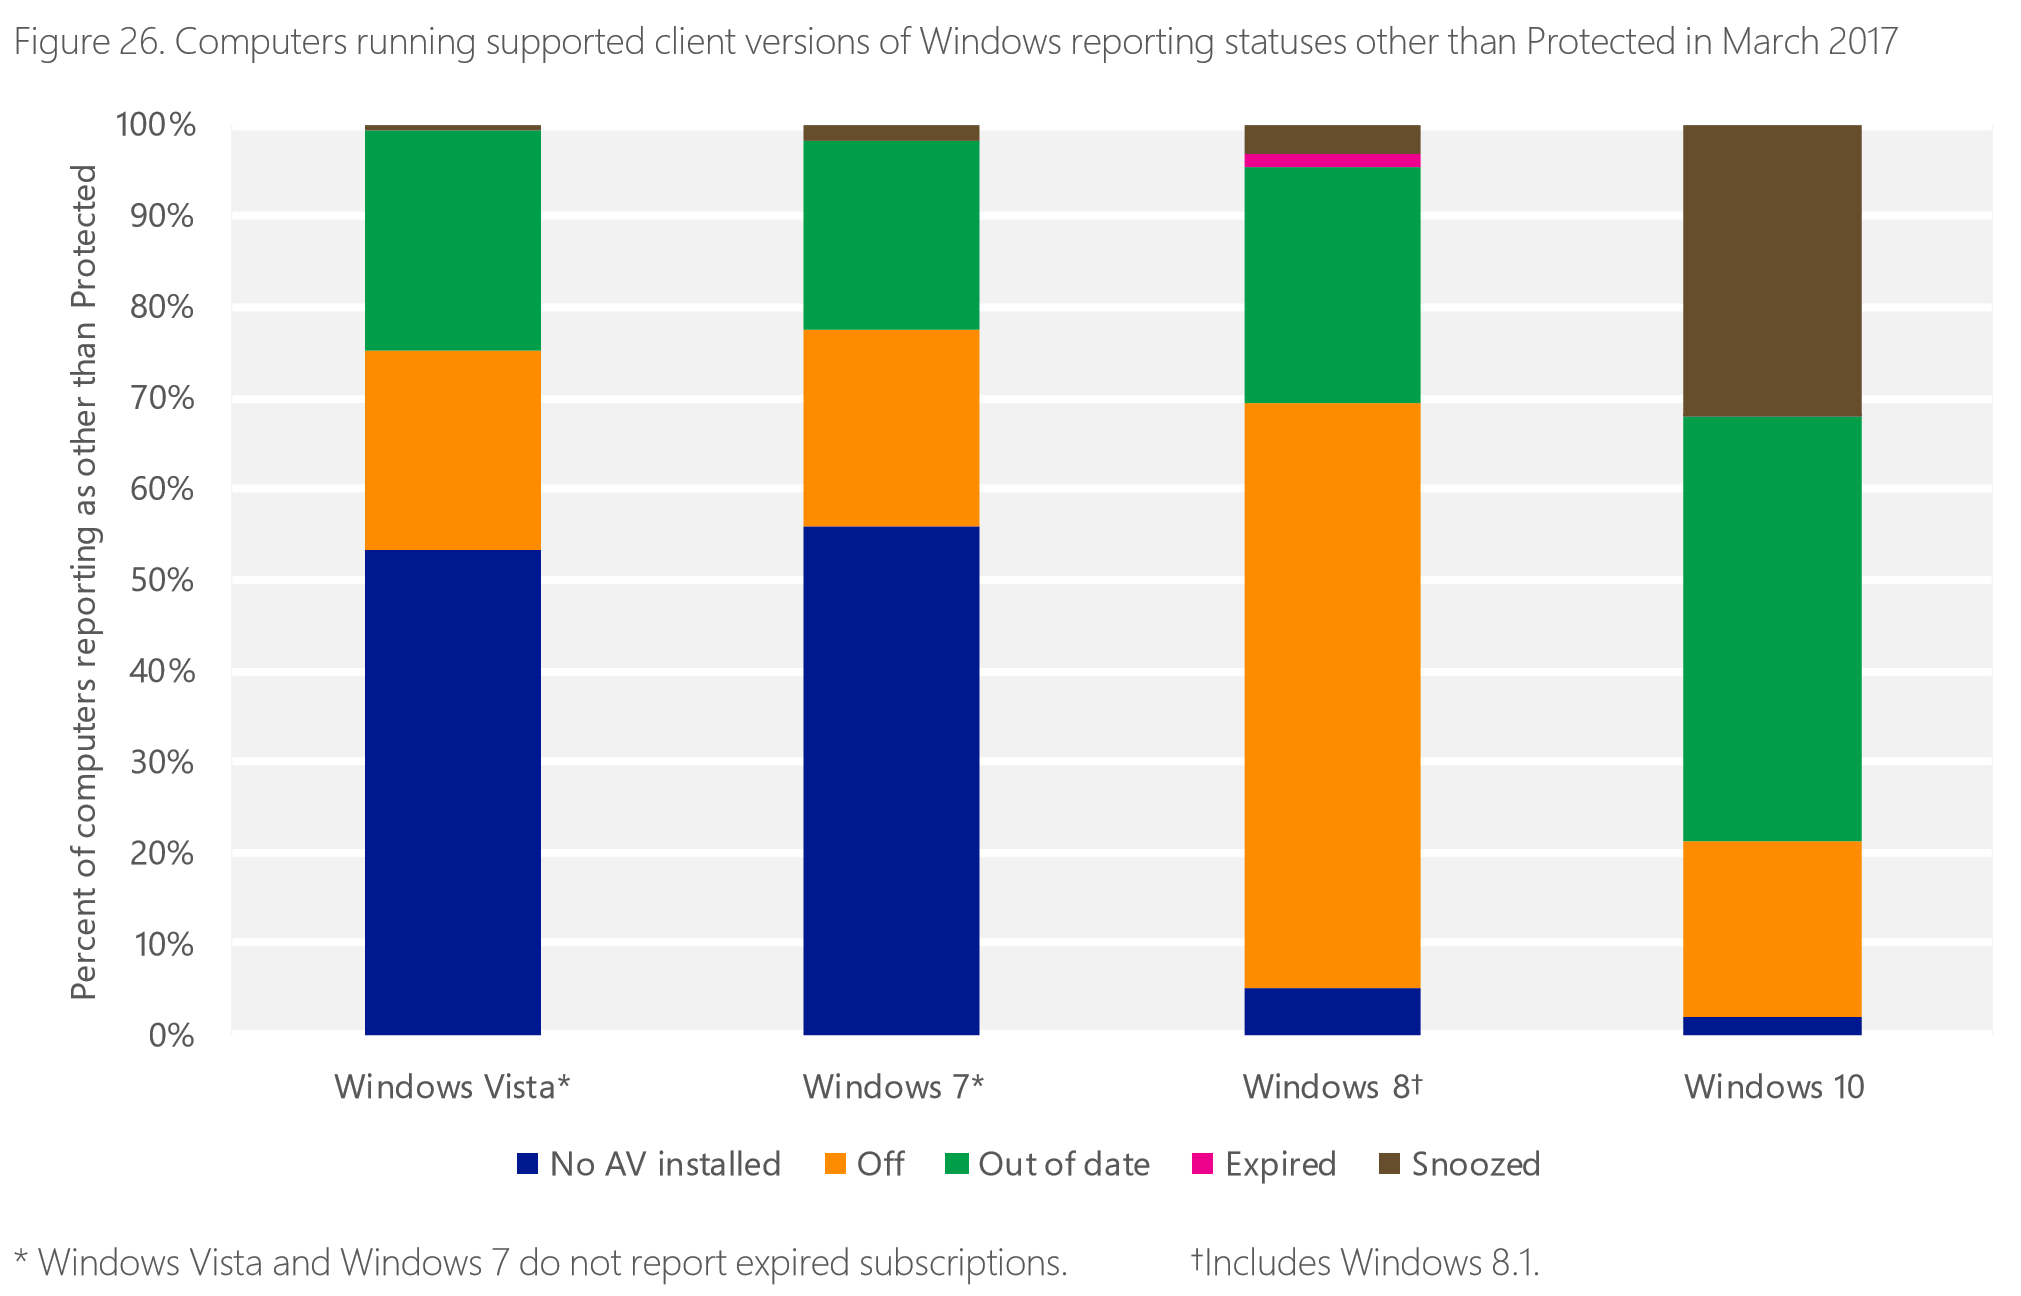
Chart - SIR Volume 22 Dated 17 August 2017
As this report has been written about over the last few days, many sites are headlining it with the statement that over 50% of Windows 7 users are not using any security software at all on their devices. I also read this chart in the same way initially.
In reality though, this chart shows the distribution of reasons why these operating systems are reporting they are not in a protected state running security software.
I have read SIR Volume 22 in this area and Microsoft is not providing the overall percentage of systems that are unprotected versus protected. That means the first point of clarity for the above chart is that it does not reflect how may systems overall are not running security software.
However, it does spell out the different reasons that these versions of Windows do not have active security software in place. So from that perspective to see that over 50% of users on Windows 7 are not running security software is quite shocking in this day and age.
It is no wonder that Windows 7 was a big target for the recent Petya and WannaCry ransom ware attacks hit this OS so hard.
According to Microsoft, the number of systems with no security software installed has dropped with Windows Defender activated by default if no other security software is present.
They also report that systems with security software installed but turned off or paused could very well be a user based action but they also point out that some malware variants can turn that software off without the user being aware of it. Of course, there are also some who disable the software for performance issues or to run software that might be detected as unsafe.
It seems the majority of these situations that result in security software being deactivated, turned off, or paused are mostly within the purview of the user. Users are key in their own security for sure and must be proactive to make sure they are protected.
My key to singling out this chart is to clarify that while it is of course possible that 50% of Windows 7 systems do not have active protection in place, unless Microsoft releases that number we will only be able to determine the percentage of that number that has it turned off.
As with any data, it must be in proper context to understand what it is telling us.
Check out the gallery of charts with a snapshot of the data it is providing us from SIR Volume 22 and then jump over and read the entire report to gain insight into the security landscape about Windows and Microsoft cloud services.
--------------------------------------
But, wait...there's probably more so be sure to follow me on Twitter and Google+.


