Just like any well-designed database, a data warehouse contains relationships. From everything that you’ve read in this series over the past year, you might be tempted to think that all relationships in a data warehouse are one-to-many (1:M), from the dimension to the fact table. However, that’s not true. Occasionally, a data warehouse requires a many-tomany (M:N) relationship.
You can successfully argue that the star schema is inherently a M:N relationship. So why are we having this discussion? Competition is forcing businesses to become more innovative, and this innovation can bring with it more products and services in combinations that might not have been considered before. This innovation also maps to increasingly complicated business models, and subsequently, to more complex data warehouse designs. A business intelligence (BI) analyst who knows how to evaluate customer buying behavior can extract information from the data warehouse to determine which combinations of products and services will entice a customer to make a purchase.
One technique the BI analysts use is called marketbasket analysis, which is the process of evaluating collections of items in the data warehouse to determine whether they’re somehow related. Market-basket analysis is frequently (but not exclusively) used in the retail sector. Information gleaned from market-basket analysis helps retailers understand buyers’ needs. Based on this analysis, retailers can better appeal to buyers by doing things such as reorganizing a store layout. For example, the idea of co-locating beer and baby diapers—so that when Dad runs to the market to pick up baby diapers, he also buys beer—was a finding that came out of early market-basket analysis efforts. Understanding the buyers’ mind-set can enable retailers to develop cross-promotional marketing programs, capture new buyers, trim inventories down to the products that sell best, and design intelligent sales events. As a data warehouse designer and DBA, you need to know how to model your database to support market-basket analysis so that your BI analysts can extract the information your business needs to beat the competition.
A good example for this discussion is a build-to-order checking account—a bank account in which customers select the features they want from a menu, essentially customizing the account and deciding how much they will pay per month in bank fees. Some features are free and some are not. The free features might include a check card with reward points (choose your favorite rewards program), online banking, bill-pay service, email alerts, no minimum balance, no direct deposit required, and identity theft insurance. Premium services might include no fees for using another bank’s ATM, rebates on ATM fees if you do use another bank’s services, interest-earning accounts, double rewards points, money back or extra rewards points on check-card purchases, anniversary cash bonuses, and overdraft fee forgiveness. Customers choose some or all of the free features and one or two of the premium features; these features are bundled into a customized checking account. Then customers can choose as many additional premium features to add to the custom account as they want for a fee of say, $2 per feature per month.
The OLTP Database Schema
If you were designing the OLTP database schema for a build-to-order checking account, it would look similar to Figure 1. This schema stores each account configuration, with general account information stored in the Account table and the features for each account stored in the AccountFeatures fact table. What’s not included in this figure are tables to capture the many types of transactions associated with an account, such as check-card purchases, purchases made with paper checks, bill-pay records, and ATM withdrawals.

Let’s assume that your datasource looks similar to Figure 1, with Account and AccountDetail in a 1:M relationship. Now your company’s CFO and vice president of marketing want to know which customers’ accounts are using which features most often and in which combinations, if any. They want to measure the efficacy of the free features versus the premium features and determine which features sell the best, so they can better direct the bank’s marketing efforts. They also want to better understand their customers’ buying behavior. In other words, the CFO and vice president of marketing want to do market-basket analysis. Why does a customer pay for a purchase one time with a check, but pays for his or her next purchase with a check card? What are the circumstances surrounding these varying types of buying behavior? If the cost to process a paper check is a set fee per check, but the cost to process a check card transaction is a percentage of the total transaction amount, it might behoove the bank to figure out a way to encourage its customers— especially the big spenders—to pay with checks.
The Star Schema
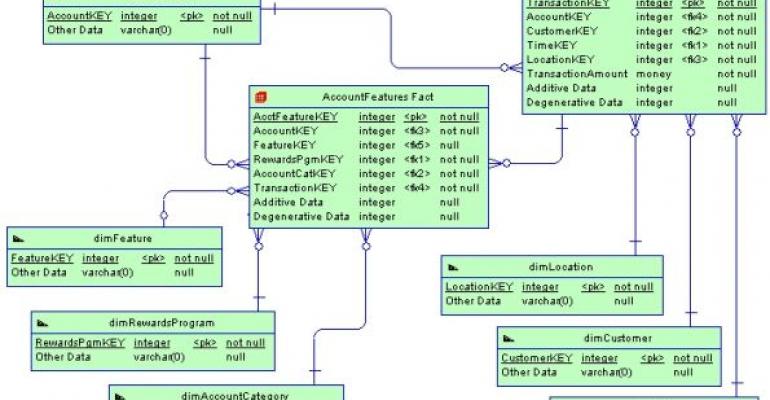
To create the star schema that will help determine the answers to these questions, you’ll need a Transaction fact table, a dimension for the Account, and an AccountFeatures fact table. In addition, you’ll need categorical dimensions for the features, account category (e.g., free, premium), and the rewards program (e.g., airline, hotel, rental car). Complexity in the schema arises from the fact that to answer the CFO’s questions, a transaction needs to link to one or more features in the AccountFeatures fact table, and each of the Account- Feature records needs to link back to its parent account. This complexity mandates a M:N relationship between the Account dimension and the Transaction fact table, as shown in Figure 2. In addition, there’s a conventional 1:M relationship between the Account dimension and the Transaction fact table.

This schema is multifunctional because you can use it for different types of analyses. The Account, Location, Customer, and Time dimensions are all conformed, meaning they can participate in multiple star schemas. Taken as a unit, the Account, Customer, Location, and Time dimensions and the Transaction fact table comprise a standard star schema model, which enables BI analysts to create cubes from these tables and extract information without regard to which account feature was used to generate the transaction. The M:N relationship between the Account dimension and the Transaction fact table, which is manifested in AccountFeatures, is the structure that will enable market-basket analysis without having to create a separate star schema. By linking each transaction with the account feature that was used to generate the transaction, BI analysts can begin to find answers to the questions asked about customer buying behavior.
By not creating two separate star schemas (i.e., a Transaction star schema and an AccountFeatures star schema), you’re saving disk storage. If you were to combine the Account and AccountFeatures tables into a single dimension, that dimension would swell by a factor of 15—more if additional features are added to the build-to-order checking account program. In previous articles, such as “Data Warehousing: Junk Dimensions,” May 2008, I have discussed the desirability of keeping dimensions tight and concise; adding features to the Account dimension would create a large, unwieldy dimension that wouldn’t function well when being cubed. Denormalizing the Transaction fact table by incorporating account feature attributes wouldn’t be the best idea, either. The fact table would contain the most records of all the tables in the schema; increasing its size and adding more keys would diminish performance and cause locking and blocking conflicts when the conventional BI analyst and the market-basket BI analyst run their programs simultaneously.
Beyond Retail
Market-basket analysis is an important operation that has uses that go beyond the retail sector. For example, you can discover relationships in a medical database, such as patients who had procedure X subsequently developing condition Y within n days/weeks/months. In a law enforcement or social profiling database, you might discover that people who engage in behavior A by age n have a d percent chance of engaging in behavior B for the rest of their life.
Market-Basket Hero
Market-basket/affinity analysis is predictive: It attempts to forecast future behavior based on past actions. Business is getting more and more competitive; in response to this pressure, they are becoming more innovative, offering product and service combinations that are derived from complex analysis of customers’ buying behaviors. You’ll need to be able to support market-basket efforts with your data warehouse design; understanding how to do so will make you a hero.
