Just this past January, Microsoft Corp. announced revenues of $26.5 billion for FY15 Q2, which ended Dec. 31, 2014. Operating income for the quarter was $7.8 billion.
Some of the highlights for the commercial business included:
· Commercial revenue growing 5% to $13.3 billion
· Commercial cloud revenue growing 114% with an annualized revenue run rate of $5.5 billion
· Server products and services revenue grew 9%
· Windows Server licensing revenue increased by 3%
· SQL Server showed double-digit growth
Overall revenues grew 8% quarter-over-quarter. For the first six-months of FY15, revenues were $49.7 billion and grew 15% compared to $43 billion in revenue for the first six months of FY14. These are all signs of a healthy ecosystem.
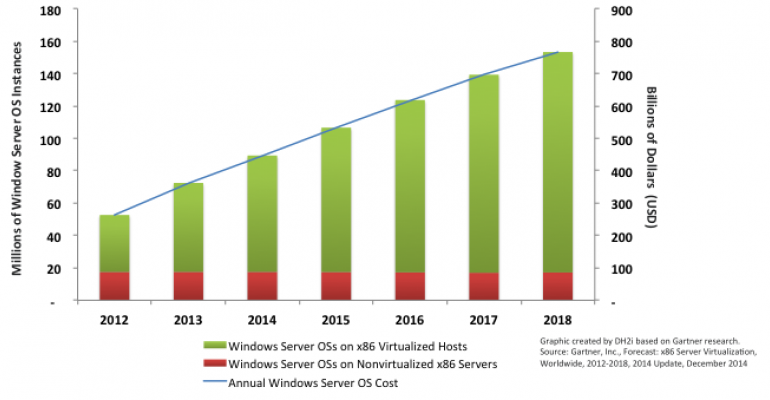
Let’s take the analysis a little further. In December 2014, Gartner published a forecast on x86 Server Virtualization, Worldwide, 2012-2018. Based on that analysis I was able to derive the following chart:
Installed Base of Windows Server OS Instances on x86 Servers Worldwide, 2012-2108

The graph is pretty simple to understand: The left vertical axis and bars chart the forecasted installed base of Windows Server OS instances over time. The right vertical axis and line chart the fully burdened (salaries, benefits, space, cooling, etc.) annual cost of those OS instances. Three takeaways from the graph are:
1. The installed base of Windows Server OS instances will grow approximately 77% from 2014 to the end of 2018. All of that growth will come from OS instances running on a virtualized host.
2. By 2018, 80% of all Windows Server OS instances will be running on a virtual host.
3. Based on Gartner’s estimate that the fully burdened annual cost of a Windows Server OS instance is approximately $6,000, the cost to support that number of OS instances will grow to over $700 billion dollars by the end of 2018.
These are additional signs of a very healthy ecosystem, but also an ecosystem ripe for new innovation in terms of lifecycle management or changing the workloads-to-OS-instance ratio. That’s where we think the next-gen innovations for Windows Server will be focused.
One of those innovations will be containers for Windows Server. In my last blog, “SQL Server Containers: Science Fiction or Reality?” I talked about some of the features and advantages of using containers. Containers for Windows Server can change the workload-to-OS instance ratio from 1-to-1 to something in the range of 8-to-1 to 15-to-1. That’s real innovation that’s occurring in the healthy and vibrant Windows ecosystem.
So, if you find yourself wondering where new data center opportunities are, just follow the money.
Until next time…


